

Welcome back! We are digging deeper into asset allocation this week.
As a refresher, we have been working through the basics of managing your portfolio each week in small, manageable steps. And, here’s what we’ve covered:
Step 1: Determining your savings goal (including reader Q&A)
Step 2: Establishing the overall asset allocation of the portfolio (i.e., the ratio of equities to fixed income investments) based on timeframe available, risk tolerance, tax bracket, and your views of the world around you (including reader Q&A)
Hopefully you’ve completed Steps 1 and 2 and are ready to “dig deeper” to achieve the optimum portfolio design for your goals and current situation.
Where does the idea of asset allocation come from?
As we touched on in Step 2, asset allocation is based on the assumption that the stock market overall will perform in a manner somewhat consistent with history. Thus, if you want to achieve a return that outpaces inflation, your portfolio needs to mimic the “entirety” of the stock market.
The great irony in investing is that “past performance does not guarantee future results,”1 even though most investing “guidance” is based on history repeating itself.
What is the “entirety” of the stock market?
The answer is different for different people. Some use the S&P 500 to measure historical returns. If that’s your index of choice, the historical perspective is:
And, as you can imagine, the S&P 500 is a market-capitalization-weighted index of 500 leading publicly traded companies in the U.S.2 This is a smaller group of only “large cap” stocks, meaning that each company has a value of more than $10 billion. Large cap is a shortened version of the term "large market capitalization." Market capitalization is calculated by multiplying the number of a company's outstanding shares by its stock price per share.
But what if you want greater diversification to hedge against risk and spread your investments across wider types of companies (including smaller companies that might have more risk but also more room for large upswings in value, like Google in 2004)? You may turn to a different index, like the Dow Jones U.S. Total Stock Market Index, which is an index designed to measure nearly all U.S. equity issues with readily available prices. Thus, In reality, this is a pool of about 3,741 stocks that make up about 95% of the U.S. stock market (based on market capitalization).[3] However, most brokerages use established indexes as well as their own proprietary tools to capture the makeup of the market which is always changing (because it is based on values that fluctuate continuously). In short, capturing the exact asset allocation in the market is basically like trying to carry Jell-O® in your bare hands.

Whatever tools you use may depend on how much information you want to sift through yourself and what brokerage service you use for your portfolio.
Deeper and deeper into equities
So back to your own asset allocation. As we learned in Step 2, the percentage of your investment portfolio that is invested in equities and fixed income is uniquely personal to you. But how can you make sure that your equities are also diversified to hopefully reduce risk and capture the widest range of market opportunities.
There are two main ways to “classify” your equities and ensure you have lots of different types of investments to cushion yourself against fluctuations with certain companies or types of businesses.
If it feels like a moving target, it is.
1. Diversification based on market capitalization
The first is market capitalization.
A portfolio that mimics the entire market in terms of market capitalization is believed to be better positioned to perform as the market has historically, and also reduce risk through having companies of many different sizes (with differing potential for growth in value).
There are three basic levels of market capitalization: large cap, mid or medium cap and small cap.
According to Investopedia:
On average, large-cap corporations—those with market capitalizations of US$10 billion and greater—tend to grow more slowly than mid-cap companies. Mid-cap companies are those with capitalizations between $2 and $10 billion, while small-cap corporations have between $300 million and $2 billion. Small caps may grow rapidly, but they often also have a greater risk of shrinking rapidly. So, when you consider the index or market you want to use (below relies primarily on the Dow Jones U.S. Total Stock Market Index)3, you can see the breakdown of the market’s entirety by market capitalization. Thus, if you hope to achieve the same historical performance, you will want your own equity portfolio to mimic this.
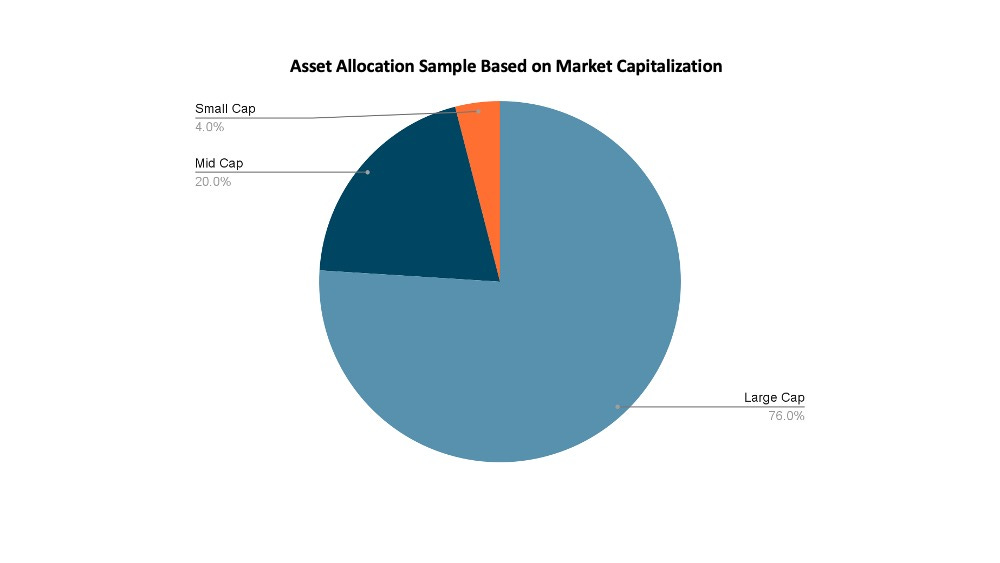
Percentages are approximate and based solely on the time that I pulled this information, and were adjusted to total 100% for ease of illustration.
Bonus diversification tip: If you use an online brokerage tool, there may also be additional breakouts by Growth, Value and Blend classifications among each level of market cap. Growth stocks are those companies that are considered to have the potential to outperform the overall market over time because of their future potential. Value stocks are classified as companies that are currently trading below what they are really worth and will thus provide a superior return.
Blend is also a term that you might see, especially for providers that focus on mutual funds and exchange traded funds. A blend fund is simply one that offers additional diversification by investing in both growth and value stocks. By using this additional lens of diversification (growth, value, and blend), you have another excellent way to compare the allocation within your equity portfolio to the total market.
(2) Diversification based on sector
The second is based on sector representation in the index you choose (or the total market). A sector is typically the “type” of business each company is in. Thus, when you see on the news that the technology industry is taking a beating in value after the various tech companies (like Alphabet and Meta) hold their earnings calls, the Information Technology sector will likely decrease as an overall portion of the market based on value.
Sector concentration in the market is also art, not science, and changes constantly as the value of each individual stock fluctuates. Typically, you will see 11 sectors, such as those defined in the Global Industry Classification Standard.
Information Technology
Financials
Health Care
Industrials
Consumer Discretionary
Communication Services
Consumer Staples
Energy
Materials
Utilities
Real Estate
Again, the allocation might look vastly different depending on the index you use, but in a “total market” scenario, you might see a breakout by sector that looks something like this:
Information Technology: 26% - 28%
Financials: 13% - 15%
Health Care: 12% - 14%
Industrials: around 10%
Consumer Discretionary: around 10%
Communication Services: around 8%
Consumer Staples: around 6%
Energy: around 4%
Materials: around 3%
Utilities: around 3%
Real Estate: around 3%
To design your portfolio in a way that “mimics” the makeup of the market (and thus might be more likely to achieve similar returns over the long haul), this is another lens to view your investments through. Generally speaking, what this tells us is that the market is heavier in Information Technology, Financials, and Health Care, with the remaining classifications representing smaller parts of the total market.
How often should I check my detailed equity allocation?
Asset allocation as art is not something that is necessarily scheduled. I use online brokerage tools to verify that I am pretty close to the allocation of the total market on a quarterly basis. I know a lot of financial professionals who do it annually. The frequency you choose will likely be based on your interest level, patience, whether you are continuing to add new funds (where you might want to select certain funds or stocks to align with the market), whether you are liquidating certain investments (you may want to choose segments that are up if you want a “gain,” down if you are “tax loss harvesting”), or if you are a “park and ride” investor.
Asset allocation is not a silver bullet
As you consider your asset allocation, when you enter the market and when you exit could also play an important role. For example:
From Seeking Alpha: While it is rare for the stock market to perform significantly lower than the historical return of 10% over a long-term period, such as 10 years, there have been such occurrences in market history. For example, the "lost decade," from January 2000 through December 2009, resulted in a -0.95% annualized return for the S&P 500.
It is for this reason that knowing how long your timeline is and ensuring that you can “wait it out” to ensure the value of your portfolio recovers is critical.
Using the performance information above, if you started investing in January 2000 and intended to start utilizing the money in 2010, you might have had to wait a bit longer for the value to rebound to achieve the historical return that you hoped for. This is why most advisors also suggest having emergency funds and cash cushions to ensure that you have funds available when you need them. This is also why your portfolio asset allocation will usually include some percentage of fixed income investments (as we reviewed in Step 2), which tend to be less volatile and more predictable (though not always).
While asset allocation is a tool in the toolbox that may make it more “likely” to achieve your desired outcome, as with everything in the markets, it is not guaranteed.
If you are ready to throw up your hands in frustration and stuff your cash in a mattress, check out why you should persevere with your investing strategy. See how stocks measure up against other things like real estate, gold, and bonds in this chart from the New York University Sterns School of Business: https://pages.stern.nyu.edu/~adamodar/New_Home_Page/datafile/histretSP.html
Dear Alice, we have not yet reached the bottom of this rabbit hole.
In the final article in the series, we will explore a comparable concept, fixed income asset allocation. We will also explore what types of accounts (retirement/tax deferred as compared to traditional brokerage, etc.) that might be best suited for particular investments and your tax situation.
And you thought I forgot…
A flavor of which is in every disclosure statement in every investment marketing brochure ever made
Technically 503 due to some weird share class things. But who’s counting?
This is the index Fidelity tends to make available in its online analysis tools.